

13-Week Cash Flow Forecaster
Projects weekly cash from live Business Central receivables, payables, open orders, and recurring items, delivered as an HTML dashboard.
Screenshots
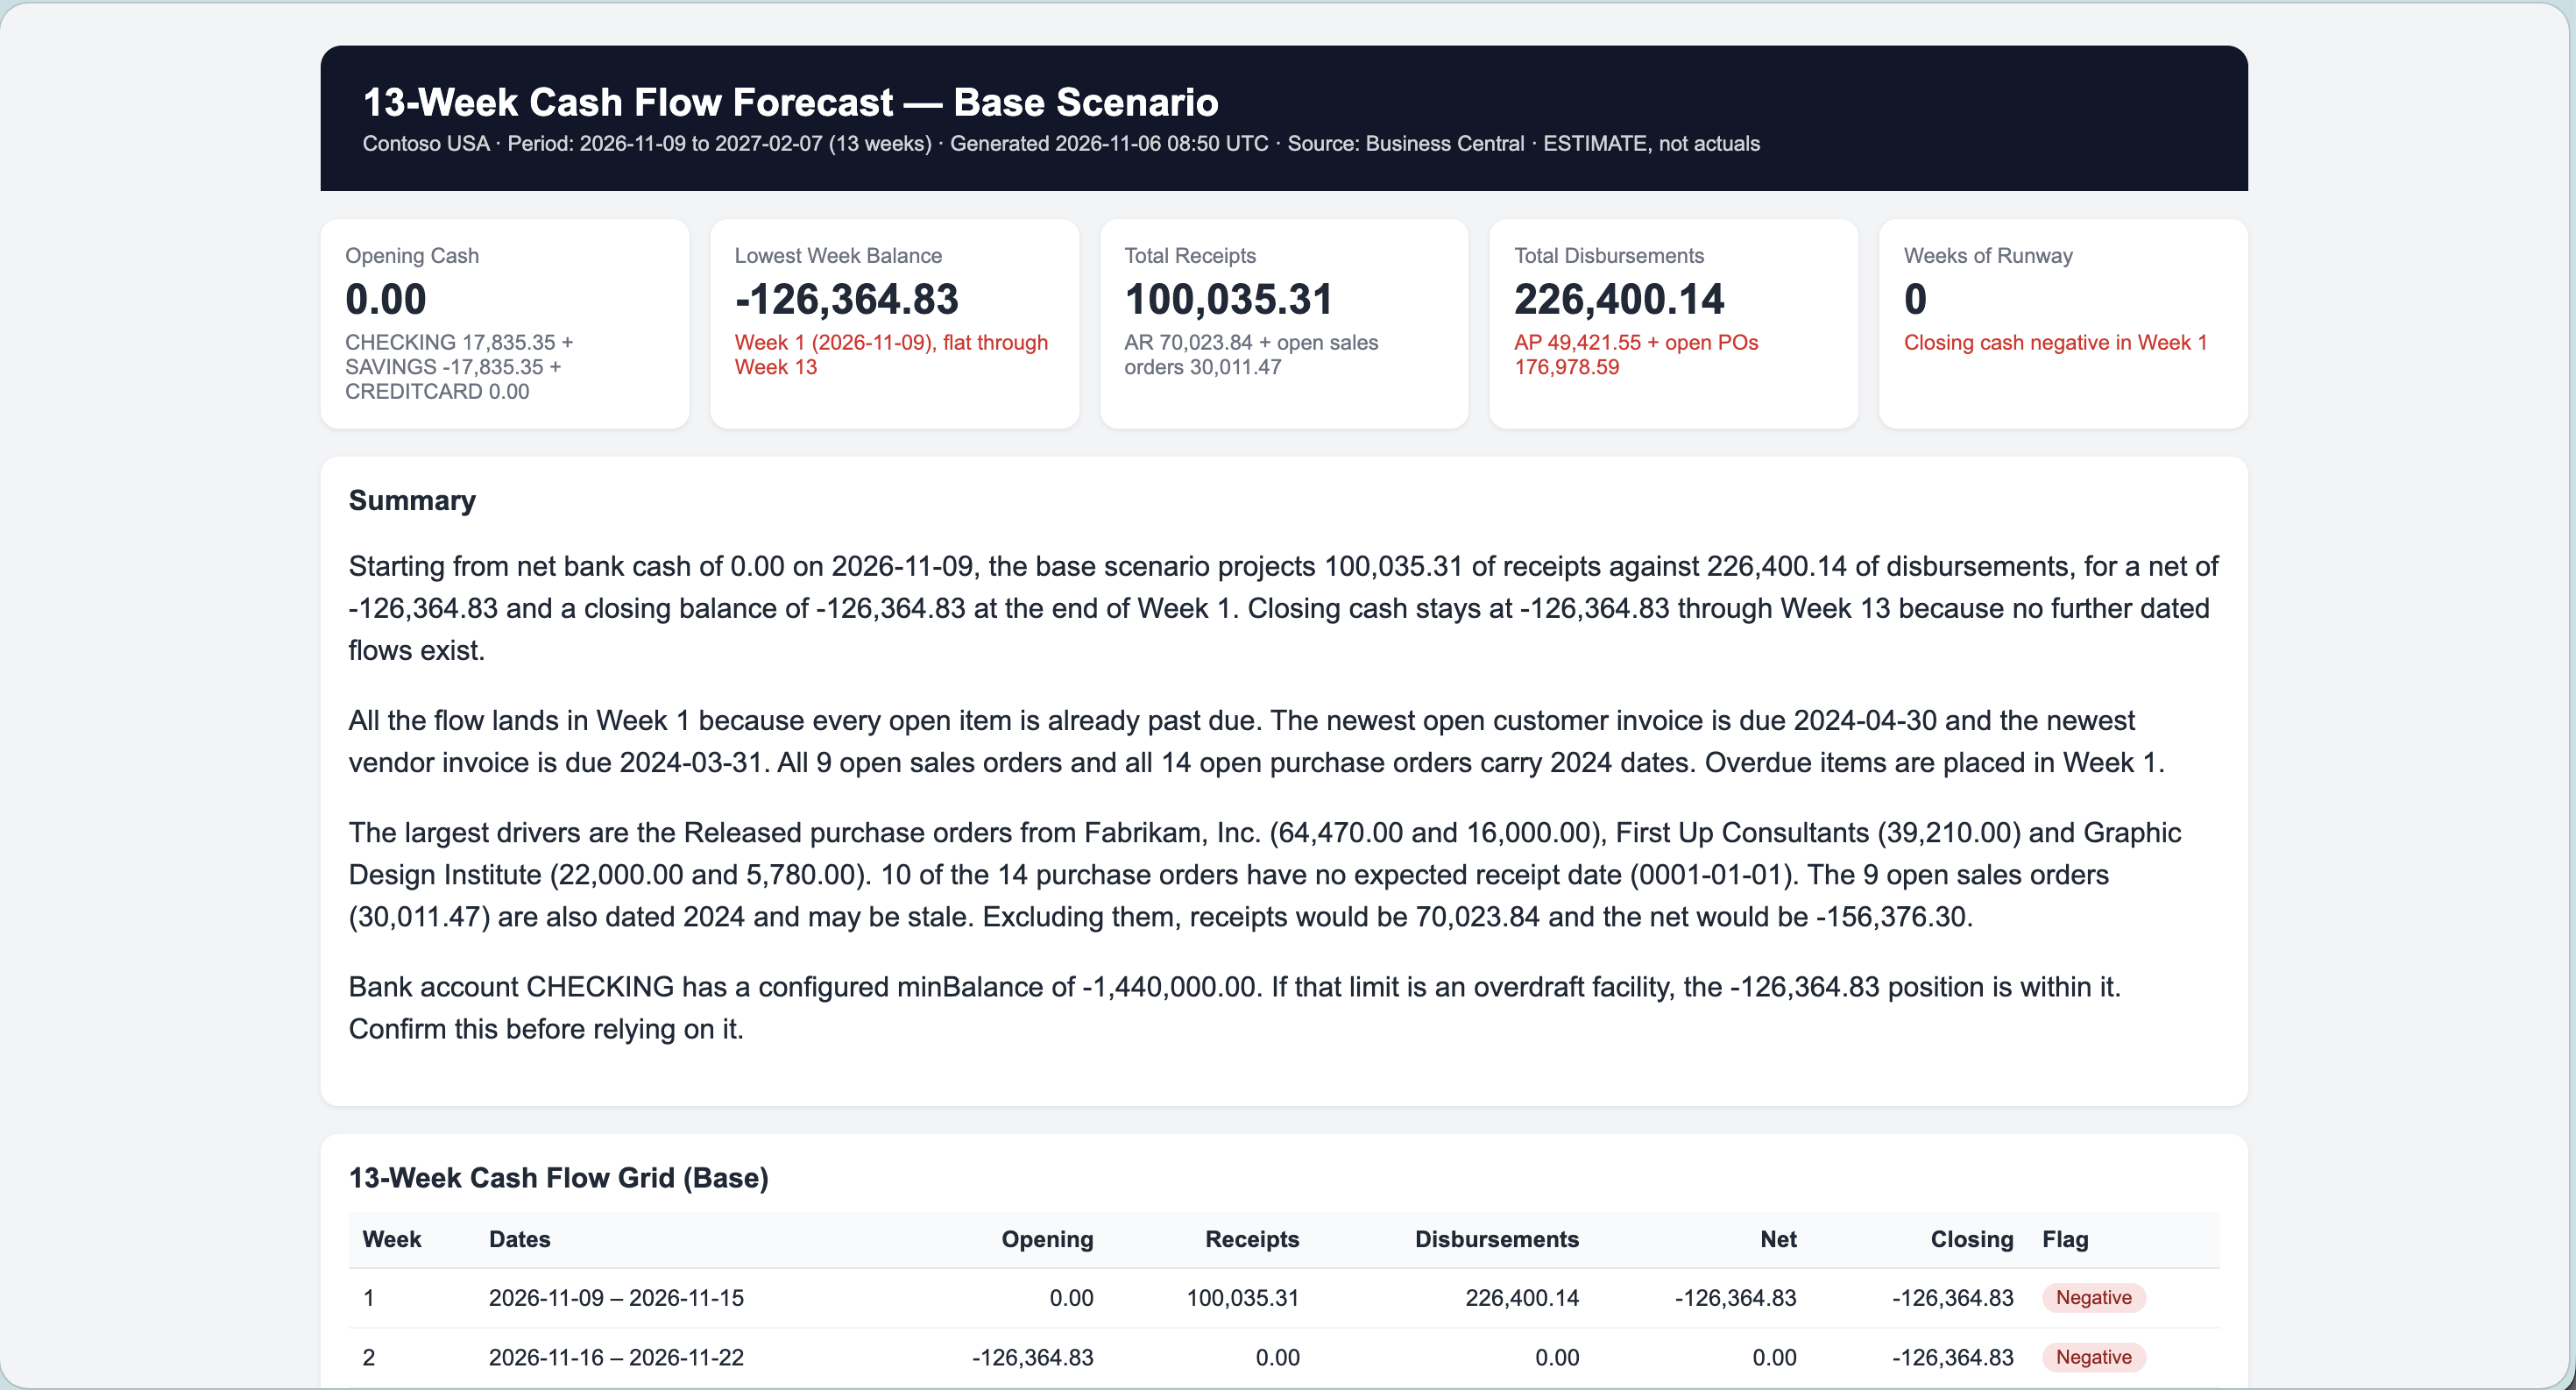
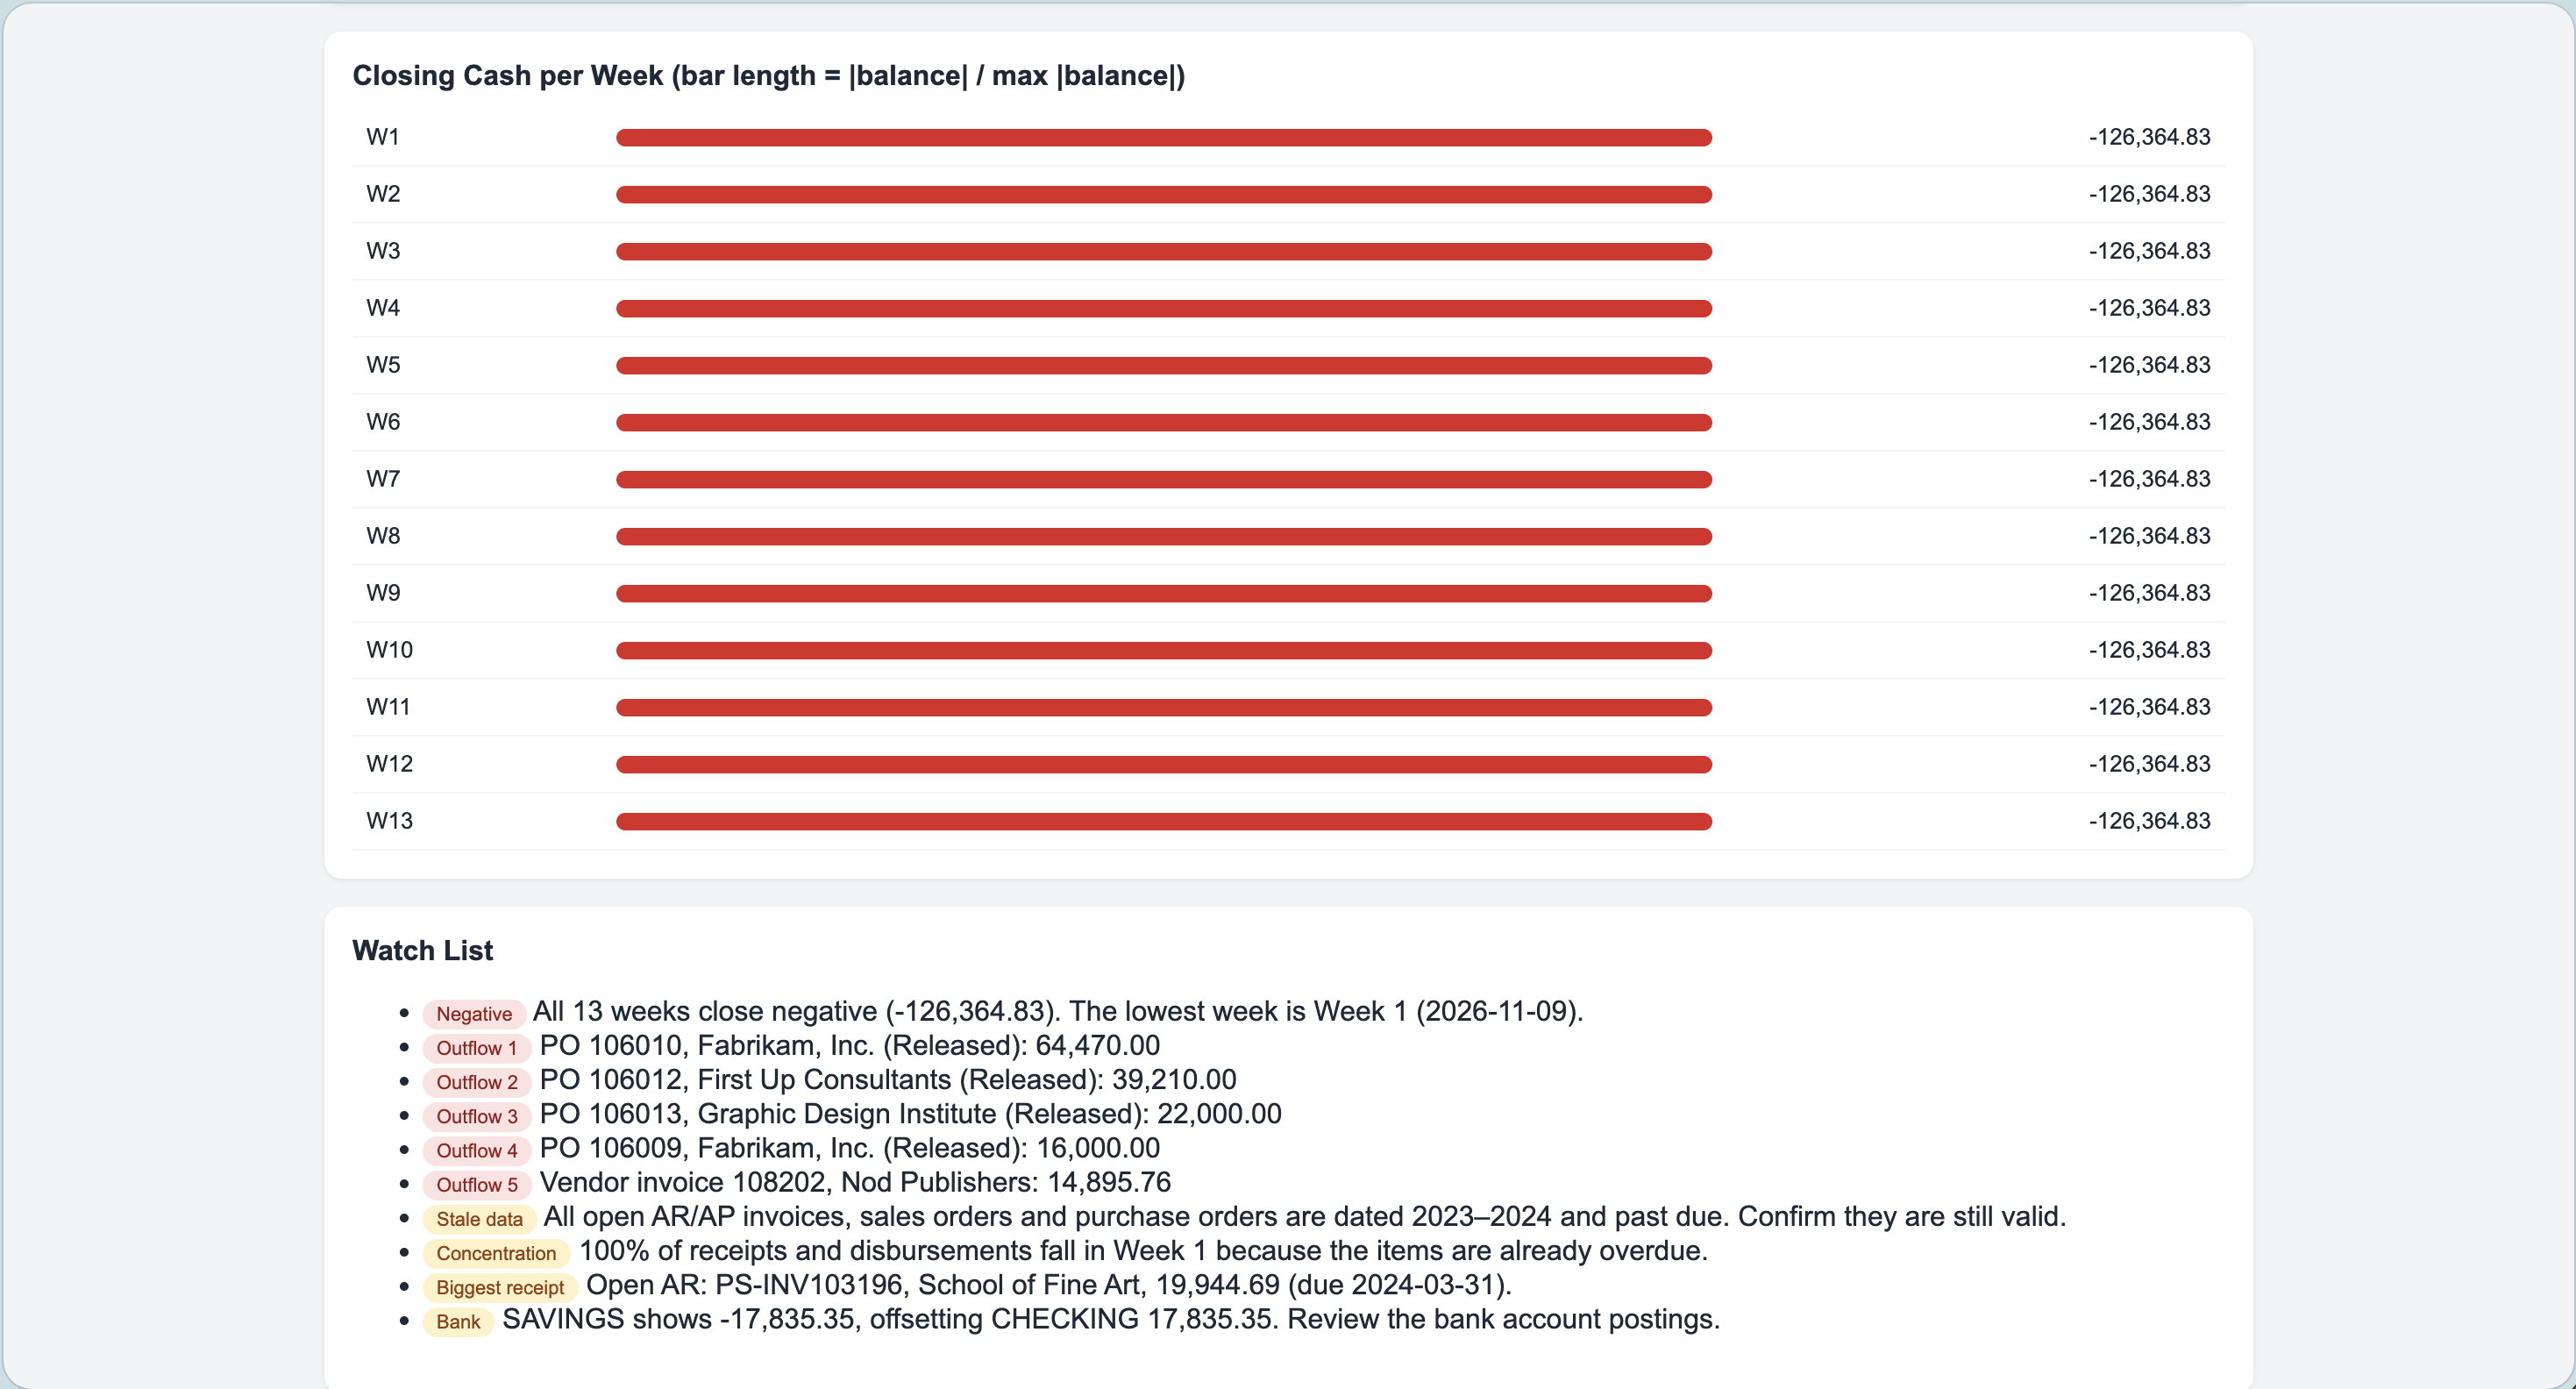
About this skill
Thirteen-Week Cash Flow Forecaster
A Business Central skill for Microsoft Copilot Studio. Uses the standard Microsoft API v2.0 plus the OCPF APIs open-source extension (180+ standard tables exposed as OData v4) for ledger-level data such as customer ledger entries, value entries, and detailed G/L entries. This file is self-contained: it needs no other skill or document.
Recommended extension: This skill is built for the OnlyCopilotFans (OCPF) BC API Catalog v3, installed in the Business Central environment. Website: https://bcapi.ai. GitHub: https://github.com/ajansari/ocpfBCAPIsV3. Every OCPF reference in this file means this catalog.
To set it up, paste Agent instructions, Conventions, and the Standard Dashboard HTML Template into the agent's Instructions or a Topic's generative node.
Purpose: Weekly cash projection from live receivables, payables, open orders, and recurring items.
Trigger phrases: "cash forecast", "13-week cash flow", "will we have enough cash", "cash runway".
Inputs: start_date (default next Monday), weeks (default 13), scenario (base | downside | upside), opening_cash_override (optional).
Data sources:
- Standard:
bankAccounts(opening balances),salesInvoicesopen withdueDate,purchaseInvoicesopen withdueDate,salesOrdersandpurchaseOrdersopen with expected dates,cashFlowStatementfor reference. - OCPF:
ocpfCustLedgerEntries(groupocpf_coreFinancial) to compute each customer's historical average days-late (expected pay date = due date + avg days late),ocpfVendorLedgerEntries(groupocpf_coreFinancial) for payment behavior,ocpfGeneralJournalLines(groupocpf_projectsAndAssets) recurring batches for payroll/rent/loan patterns.
Agent instructions:
Build a week-by-week table: Opening cash, Receipts (AR collections, open sales orders converting at historical order-to-invoice lag), Disbursements (AP by due date, open POs at expected receipt + vendor terms, recurring items), Net, Closing cash. Base scenario uses historical pay behavior; downside shifts receipts out one week and collects 85%; upside collects on due date. Flag any week where closing cash < 0 or below a minimum the user specifies. Fill the Standard Dashboard HTML: KPIs = Opening Cash, Lowest Week Balance, Total Receipts, Total Disbursements, Weeks of Runway; primary table = the 13-week grid; bar chart = closing cash per week; watch list = negative weeks and top five largest single outflows; assumptions_note lists every lag and collection rate used.
Steps:
- Opening cash from bank accounts (or override).
- Receipts: open invoices by expected pay date; open orders by expected invoice date.
- Disbursements: open purchase invoices and POs; recurring journals projected forward.
- Build grid per scenario; compute runway.
- Fill template; return HTML; offer to save or email.
Output contract: Standard Dashboard HTML plus a one-paragraph verdict.
Guardrails: Read-only. Clearly label projections as estimates; never state them as actuals.
Conventions
- Authentication: Business Central connector (delegated) or an HTTP Request action using an Entra app with S2S permissions. Store tenant ID, environment, and company ID as environment variables:
BC_TENANT,BC_ENV,BC_COMPANY_ID. - Base URLs: Standard API:
https://api.businesscentral.dynamics.com/v2.0/{BC_TENANT}/{BC_ENV}/api/v2.0/companies({BC_COMPANY_ID})/. OCPF APIs:https://api.businesscentral.dynamics.com/v2.0/{BC_TENANT}/{BC_ENV}/api/OnlyCopilotFans/{group}/v3.1/companies({BC_COMPANY_ID})/{entity}, with the group and entity given for each OCPF data source. - Paging: Always use
$top=1000and follow@odata.nextLink. Use$selectto limit columns and$filteron dates. - Dates: Resolve relative dates ("this month", "last quarter") in the agent before building filters. Use ISO
yyyy-MM-dd. - Money: Format in company currency with thousands separators and two decimals. Never invent numbers; if an API call fails, say so and stop.
- OCPF availability: This skill is built for the OCPF catalog. If an OCPF endpoint or field is unavailable, skip only the affected fields instead of failing, carry on, and note what was skipped. This is the one exception to stopping on a failed call.
- Analytics output: This skill emits the Standard Dashboard HTML below.
Standard Dashboard HTML Template
The agent fills the {{placeholders}} and returns the complete HTML as a single code block (or writes it to SharePoint/OneDrive via a connector action). Inline CSS only, no external assets, so it renders in Teams, email, and a browser.
<!DOCTYPE html>
<html lang="en"><head><meta charset="utf-8">
<title>{{report_title}} — {{company_name}}</title>
<style>
  body{font-family:Segoe UI,Arial,sans-serif;margin:0;background:#f3f4f6;color:#1f2937}
  .wrap{max-width:1100px;margin:0 auto;padding:24px}
  header{background:#0f172a;color:#fff;padding:20px 24px;border-radius:12px 12px 0 0}
  header h1{margin:0;font-size:22px} header .meta{font-size:12px;opacity:.8;margin-top:4px}
  .kpis{display:grid;grid-template-columns:repeat(auto-fit,minmax(180px,1fr));gap:12px;margin:16px 0}
  .kpi{background:#fff;border-radius:10px;padding:14px;box-shadow:0 1px 3px rgba(0,0,0,.08)}
  .kpi .label{font-size:12px;color:#6b7280} .kpi .value{font-size:24px;font-weight:600;margin-top:4px}
  .kpi .delta{font-size:12px;margin-top:4px} .up{color:#059669} .down{color:#dc2626} .flat{color:#6b7280}
  section{background:#fff;border-radius:10px;padding:16px;margin-bottom:16px;box-shadow:0 1px 3px rgba(0,0,0,.08)}
  section h2{font-size:16px;margin:0 0 10px}
  table{width:100%;border-collapse:collapse;font-size:13px}
  th{background:#f9fafb;text-align:left;padding:8px;border-bottom:1px solid #e5e7eb}
  td{padding:8px;border-bottom:1px solid #f3f4f6} td.num,th.num{text-align:right}
  .bar{height:10px;background:#e5e7eb;border-radius:5px;overflow:hidden} .bar span{display:block;height:100%;background:#2563eb}
  .narrative p{line-height:1.5} .flag{display:inline-block;padding:2px 8px;border-radius:999px;font-size:11px}
  .flag.red{background:#fee2e2;color:#991b1b} .flag.amber{background:#fef3c7;color:#92400e} .flag.green{background:#d1fae5;color:#065f46}
  footer{font-size:11px;color:#6b7280;padding:8px 0 24px}
</style></head>
<body><div class="wrap">
<header><h1>{{report_title}}</h1><div class="meta">{{company_name}} · Period: {{period_label}} · Generated {{generated_at}} · Source: Business Central</div></header>
<div class="kpis">
  <!-- repeat per KPI (4 to 6 tiles) -->
  <div class="kpi"><div class="label">{{kpi_label}}</div><div class="value">{{kpi_value}}</div><div class="delta {{up|down|flat}}">{{kpi_delta_text}}</div></div>
</div>
<section class="narrative"><h2>Summary</h2>{{narrative_paragraphs}}</section>
<section><h2>{{primary_table_title}}</h2>
<table><thead><tr>{{th_cells}}</tr></thead><tbody>{{tr_rows}}</tbody></table></section>
<section><h2>{{chart_title}}</h2>
<!-- simple CSS bar chart: one row per category, width = value / max * 100 -->
<table>{{bar_rows: <tr><td>label</td><td style="width:60%"><div class="bar"><span style="width:NN%"></span></div></td><td class="num">value</td></tr>}}</table></section>
<section><h2>Watch List</h2><ul>{{watch_items: <li><span class="flag red|amber|green">tag</span> text</li>}}</ul></section>
<footer>Data pulled via Business Central API v2.0 / OCPF APIs. Figures in {{currency}}. {{assumptions_note}}</footer>
</div></body></html>
Required placeholders: report_title, company_name, period_label, generated_at, 4–6 KPI tiles, 2–4 narrative paragraphs, one primary table, one bar chart section, a watch list, and assumptions_note.
Suggested prompts
- Run a 13-week cash flow forecast.
- Will we have enough cash over the next 13 weeks?
- Show me the downside 13-week cash forecast with a minimum balance of 250,000.
- What does our cash runway look like in the upside scenario?
- Run a 13-week cash forecast starting next Monday with opening cash of 800,000.
- Run a downside 13-week cash forecast and flag any week where closing cash drops below 250,000.
Dependencies
This skill requires you to install the free, open-source OnlyCopilotFans BC API v3 Catalog PTE app
Read more about this app and download on https://bcapi.ai
Connectors needed
View SKILL.md
---
name: thirteen-week-cash-flow-forecaster
description: "Projects weekly cash from live Business Central receivables, payables, open orders, and recurring items, delivered as an HTML dashboard. Use when the user says 'cash forecast', '13-week cash flow', 'will we have enough cash', or 'cash runway'. Built for the OnlyCopilotFans (OCPF) BC API Catalog v3."
---

# Thirteen-Week Cash Flow Forecaster

A Business Central skill for Microsoft Copilot Studio, built on the OnlyCopilotFans (OCPF) BC API Catalog v3 (180+ Business Central tables exposed as OData v4). All data comes from this catalog. This file is self-contained: it needs no other skill or document.

**Data source:** The OnlyCopilotFans (OCPF) BC API Catalog v3, installed in the Business Central environment. Website: https://bcapi.ai. GitHub: https://github.com/ajansari/ocpfBCAPIsV3. Every OCPF reference in this file means this catalog.

To set it up, paste **Agent instructions**, **Conventions**, and the **Standard Dashboard HTML Template** into the agent's Instructions or a Topic's generative node.

**Purpose:** Weekly cash projection from live receivables, payables, open orders, and recurring items.

**Trigger phrases:** "cash forecast", "13-week cash flow", "will we have enough cash", "cash runway".

**Inputs:** `start_date` (default next Monday), `weeks` (default 13), `scenario` (base | downside | upside), `opening_cash_override` (optional).

**Data sources (OCPF catalog):**

- `ocpfBankAccounts` (group `ocpf_masterData`): `balanceLcy` for opening balances.
- `ocpfCustLedgerEntries` (group `ocpf_coreFinancial`): open entries (`remainingAmtLcy`, `dueDate`) for receivables, and invoices closed in the last 12 months (`postingDate ge`) to compute each customer's historical average days-late (expected pay date = due date + avg days late).
- `ocpfVendorLedgerEntries` (group `ocpf_coreFinancial`): open entries (`remainingAmtLcy`, `dueDate`) for payables, and entries closed in the last 12 months (`postingDate ge`) for payment behavior.
- `ocpfSalesOrders` (group `ocpf_sales`) and `ocpfPurchaseOrders` (group `ocpf_purchasing`): open orders with expected dates (`shipmentDate`, `expectedReceiptDate`).
- `ocpfGeneralJournalLines` (group `ocpf_projectsAndAssets`): recurring batches for payroll/rent/loan patterns.

**Agent instructions:**

> Build a week-by-week table: Opening cash, Receipts (AR collections, open sales orders converting at historical order-to-invoice lag), Disbursements (AP by due date, open POs at expected receipt + vendor terms, recurring items), Net, Closing cash. Base scenario uses historical pay behavior; downside shifts receipts out one week and collects 85%; upside collects on due date. Flag any week where closing cash < 0 or below a minimum the user specifies. Fill the Standard Dashboard HTML: KPIs = Opening Cash, Lowest Week Balance, Total Receipts, Total Disbursements, Weeks of Runway; primary table = the 13-week grid; bar chart = closing cash per week; watch list = negative weeks and top five largest single outflows; assumptions_note lists every lag and collection rate used.

**Steps:**

1. Opening cash from bank accounts (or override).
2. Receipts: open invoices by expected pay date; open orders by expected invoice date.
3. Disbursements: open purchase invoices and POs; recurring journals projected forward.
4. Build grid per scenario; compute runway.
5. Fill template; return HTML; offer to save or email.

**Output contract:** Standard Dashboard HTML plus a one-paragraph verdict.

**Guardrails:** Read-only. Clearly label projections as estimates; never state them as actuals.

## Conventions

- **Authentication:** Business Central connector (delegated) or an HTTP Request action using an Entra app with S2S permissions. Store tenant ID, environment, and company ID as environment variables: `BC_TENANT`, `BC_ENV`, `BC_COMPANY_ID`.
- **Base URL:** `https://api.businesscentral.dynamics.com/v2.0/{BC_TENANT}/{BC_ENV}/api/OnlyCopilotFans/{group}/v3.1/companies({BC_COMPANY_ID})/{entity}`, with the group and entity given for each data source.
- **Paging:** Always use `$top=1000` and follow `@odata.nextLink`. Use `$select` to limit columns and `$filter` on dates.
- **Dates:** Resolve relative dates ("this month", "last quarter") in the agent before building filters. Use ISO `yyyy-MM-dd`.
- **Money:** Format in company currency with thousands separators and two decimals. Never invent numbers; if an API call fails, say so and stop.
- **OCPF availability:** This skill is built for the OCPF catalog. If an OCPF endpoint or field is unavailable, skip only the affected fields instead of failing, carry on, and note what was skipped. This is the one exception to stopping on a failed call.
- **Analytics output:** This skill emits the **Standard Dashboard HTML** below.

## Standard Dashboard HTML Template

The agent fills the `{{placeholders}}` and returns the complete HTML as a single code block (or writes it to SharePoint/OneDrive via a connector action). Inline CSS only, no external assets, so it renders in Teams, email, and a browser.

```html
<!DOCTYPE html>
<html lang="en"><head><meta charset="utf-8">
<title>{{report_title}} — {{company_name}}</title>
<style>
  body{font-family:Segoe UI,Arial,sans-serif;margin:0;background:#f3f4f6;color:#1f2937}
  .wrap{max-width:1100px;margin:0 auto;padding:24px}
  header{background:#0f172a;color:#fff;padding:20px 24px;border-radius:12px 12px 0 0}
  header h1{margin:0;font-size:22px} header .meta{font-size:12px;opacity:.8;margin-top:4px}
  .kpis{display:grid;grid-template-columns:repeat(auto-fit,minmax(180px,1fr));gap:12px;margin:16px 0}
  .kpi{background:#fff;border-radius:10px;padding:14px;box-shadow:0 1px 3px rgba(0,0,0,.08)}
  .kpi .label{font-size:12px;color:#6b7280} .kpi .value{font-size:24px;font-weight:600;margin-top:4px}
  .kpi .delta{font-size:12px;margin-top:4px} .up{color:#059669} .down{color:#dc2626} .flat{color:#6b7280}
  section{background:#fff;border-radius:10px;padding:16px;margin-bottom:16px;box-shadow:0 1px 3px rgba(0,0,0,.08)}
  section h2{font-size:16px;margin:0 0 10px}
  table{width:100%;border-collapse:collapse;font-size:13px}
  th{background:#f9fafb;text-align:left;padding:8px;border-bottom:1px solid #e5e7eb}
  td{padding:8px;border-bottom:1px solid #f3f4f6} td.num,th.num{text-align:right}
  .bar{height:10px;background:#e5e7eb;border-radius:5px;overflow:hidden} .bar span{display:block;height:100%;background:#2563eb}
  .narrative p{line-height:1.5} .flag{display:inline-block;padding:2px 8px;border-radius:999px;font-size:11px}
  .flag.red{background:#fee2e2;color:#991b1b} .flag.amber{background:#fef3c7;color:#92400e} .flag.green{background:#d1fae5;color:#065f46}
  footer{font-size:11px;color:#6b7280;padding:8px 0 24px}
</style></head>
<body><div class="wrap">
<header><h1>{{report_title}}</h1><div class="meta">{{company_name}} · Period: {{period_label}} · Generated {{generated_at}} · Source: Business Central</div></header>
<div class="kpis">
  <!-- repeat per KPI (4 to 6 tiles) -->
  <div class="kpi"><div class="label">{{kpi_label}}</div><div class="value">{{kpi_value}}</div><div class="delta {{up|down|flat}}">{{kpi_delta_text}}</div></div>
</div>
<section class="narrative"><h2>Summary</h2>{{narrative_paragraphs}}</section>
<section><h2>{{primary_table_title}}</h2>
<table><thead><tr>{{th_cells}}</tr></thead><tbody>{{tr_rows}}</tbody></table></section>
<section><h2>{{chart_title}}</h2>
<!-- simple CSS bar chart: one row per category, width = value / max * 100 -->
<table>{{bar_rows: <tr><td>label</td><td style="width:60%"><div class="bar"><span style="width:NN%"></span></div></td><td class="num">value</td></tr>}}</table></section>
<section><h2>Watch List</h2><ul>{{watch_items: <li><span class="flag red|amber|green">tag</span> text</li>}}</ul></section>
<footer>Data pulled via the OCPF BC API Catalog v3. Figures in {{currency}}. {{assumptions_note}}</footer>
</div></body></html>
```

**Required placeholders:** `report_title`, `company_name`, `period_label`, `generated_at`, 4–6 KPI tiles, 2–4 narrative paragraphs, one primary table, one bar chart section, a watch list, and `assumptions_note`.
Files in v1.1.0
| Path | Size |
|---|---|
| SKILL.md | 8.0 KB |